3 - Exploring Outputs from segclust2d
R. Patin
2022-09-06
Source:vignettes/v03_explore_outputs.Rmd
v03_explore_outputs.RmdPossible outputs and general functioning
Both segmentation() and segclust() return
objects of segmentation-class for which several functions
are available (see below).
General functioning
There are two types of function: (1) some are general and show likelihood for all the different segmentations; (2) other are specific to a given segmentation and requires selecting a number of segments and of clusters (if applicable).
Default values for nseg and ncluster
For the functions specific to a given segmentation, if you do not provide as argument the number of segments and of clusters, the functions will automatically select the best arguments based on a penalized log-likelihood as following:
for outputs of
segmentation()the optimal number of segments is selected with Lavielle’s criterium. Other numbers of segments may be provided with argumentsnseg.for outputs of
segclust()the optimal numbers of clusters and segments are selected with a BIC-based penalized criterium. Other parameters may be provided with argumentsnsegandncluster. It is recommended to manually choose the number of clusters based on biological knowledge or careful exploration of the BIC-based penalized likelihood. Once the number of clusters was chosen (either manually or automatically) it is recommended to select the number of segments using the automatic BIC-based penalized likelihood criterium.
Graphical outputs
All plot methods use ggplot2 package and return
ggplot objects that can be further modified and customized
using classical ggplot2 (see ggplot2 function
reference).
Default value for order
If you provide argument order = TRUE to a function
specific to a segmentation, then the different segments or clusters will
be numbered ordered by the variable provided as order.var
in the segmentation() or segclust() call.
List of functions
- Graphical outputs
For a specific segmentation:
-
plot.segmentationto show the segmented time-series, and clusters if applicable. -
segmapto show the results of the segmentation as a labelled path (if applicable). -
stateplotplot summary statistics for all segments or clusters.
Summary for all segmentations:
-
plot_likelihoodfor segmentation() show the log-likelihood of the segmentation for all numbers of segments. -
plot_BICfor segclust() show the BIC-based penalized log-likelihood of the segmentation.clustering for all numbers of segments and clusters.
- Extracting results
For a specific segmentation:
-
augmentreturns a data.frame with the original data as well as the segment or cluster associated for each data point -
segmentreturns a data.frame with the beginning and end of each segment -
statesforsegclustprovides a data.frame with summary statistics for all clusters
Summary for all segmentations:
-
logLikforsegmentation()returns a data.frame with the log-likelihood for all numbers of segments. -
BICforsegclust()returns a data.frame with the BIC-based penalized log-likelihood for all numbers of clusters and segments.
Examples
As functions for segmentation and segmentation/clustering are very
similar, we will show examples mostly for the segmentation/clustering
outputs, but the use is very similar, argument ncluster
just need to be omitted for obtaining outputs for segmentation.
data(simulmode)
simulmode$abs_spatial_angle <- abs(simulmode$spatial_angle)
simulmode <- simulmode[!is.na(simulmode$abs_spatial_angle), ]
mode_segclust <- segclust(simulmode,
                          Kmax = 20, lmin=10, ncluster = c(2,3),
                          seg.var = c("speed","abs_spatial_angle"),
                          scale.variable = TRUE)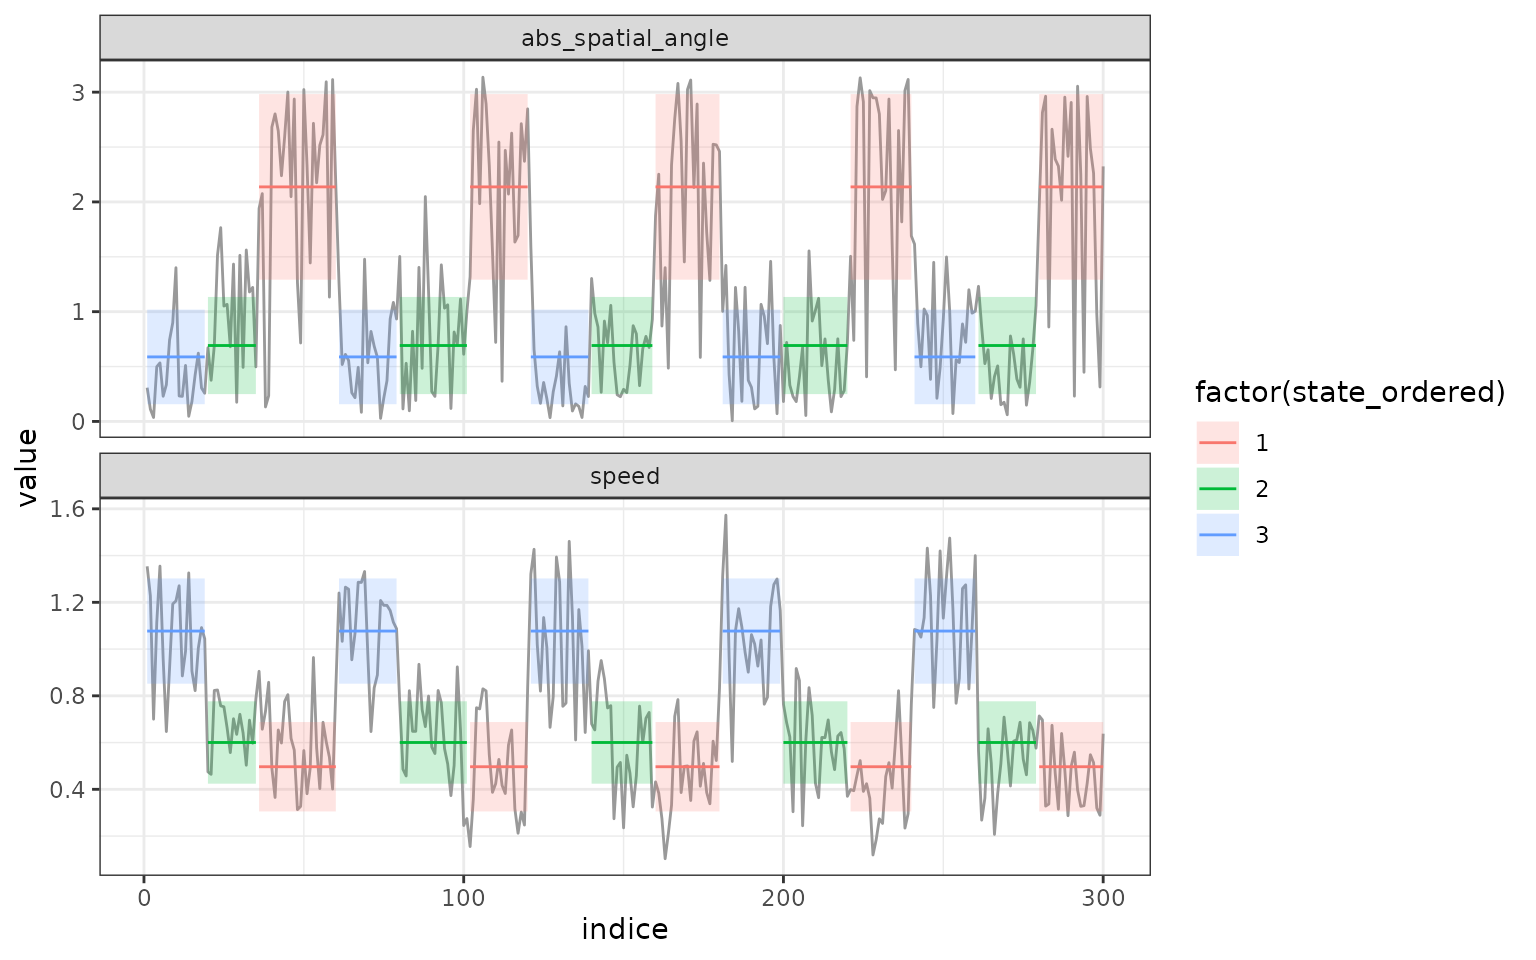
segmap - map the segmentation
segmap() plots the results of the segmentation as a
labelled path. This can be done only if data have a geographic meaning.
Coordinate names are by default “x” and “y” but they can be provided
through argument coord.names.
segmap(mode_segclust, ncluster = 3)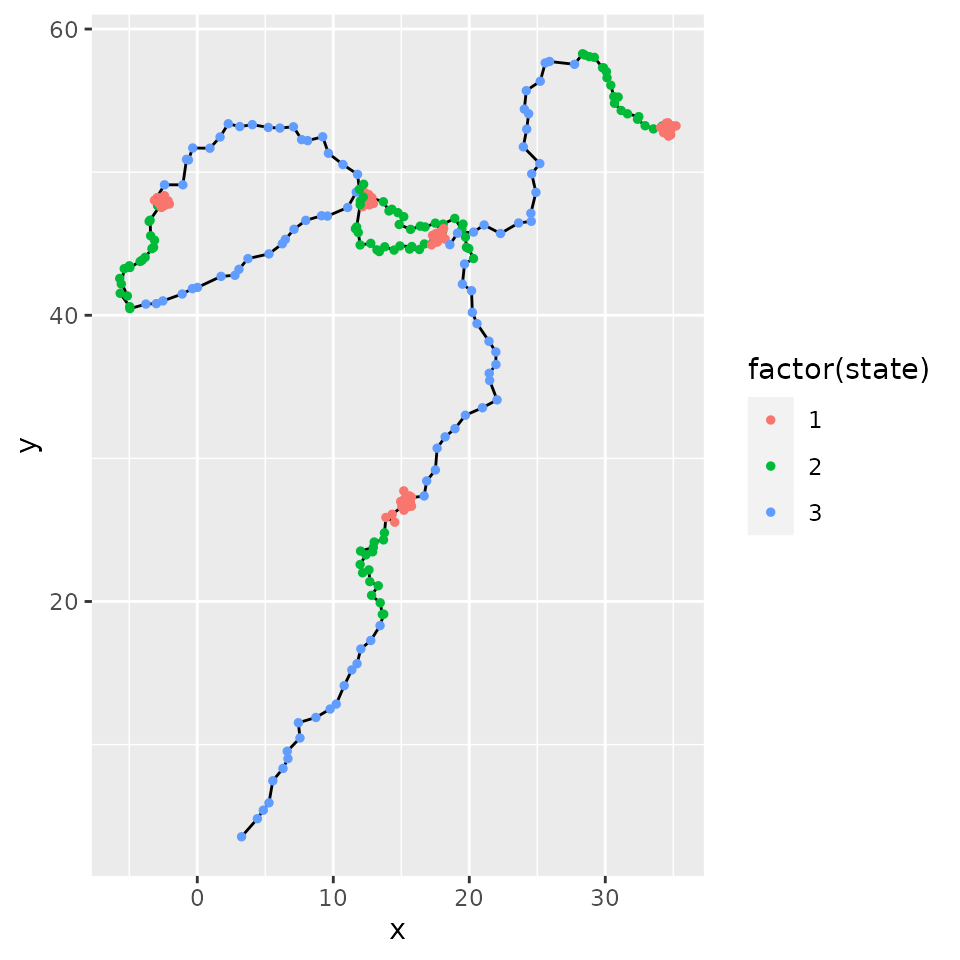
stateplot - plot states statistics
stateplot() shows statistics for each state or
segment.
stateplot(mode_segclust, ncluster = 3)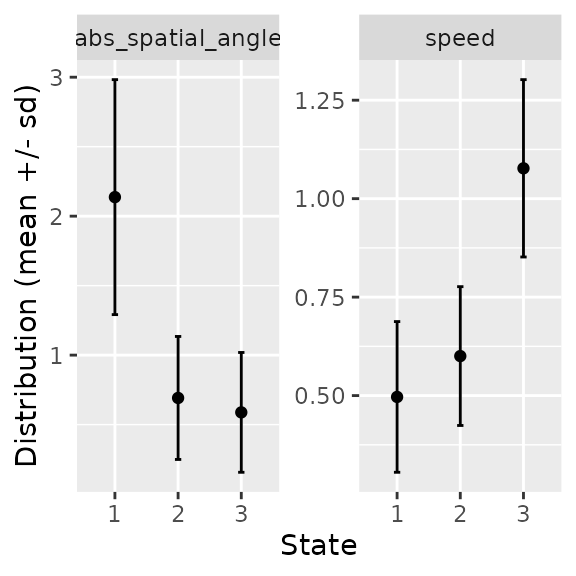
Extract information from segmentation
augment - get data.frame with segment/cluster information for all points
augment.segmentation() is a method for
broom::augment. It returns an augmented data.frame with
outputs of the model - here, the attribution to segment or cluster.
augment(mode_segclust, ncluster = 3)segment - Extract each segment (begin, end, statistics)
segment() makes it possible to retrieve information on
the different segments for a given segmentation. Each segment is
associated with the mean and standard deviation for each variable, the
state (equivalent to the segment number for segmentation)
and the state ordered given a variable - by default the first variable
given by seg.var. One can specify the variable for ordering
states through the order.var of segmentation()
and segclust().
segment(mode_segclust, ncluster = 3)states - statistics about each states.
states() returns information on the different states of
the segmentation. For segmentation() it is quite similar to
segment(). For segclust, however it gives the
different clusters found and the statistics associated.
states(mode_segclust, ncluster = 3)Get likelihood for all segmentation or segmentation/clustering
log-Likelihood (segmentation)
logLik.segmentation() return information on the
log-likelihood of the different segmentations possible. It returns a
data.frame with the number of segments and the log-likelihood.
data("simulshift")
shift_seg <- segmentation(simulshift,
                          seg.var = c("x","y"),
                          lmin = 240, Kmax = 25,
                          subsample_by = 60)
logLik(shift_seg)plot_likelihood() plots the log-likelihood of the
segmentation for all the tested numbers of segments and clusters.
plot_likelihood(shift_seg)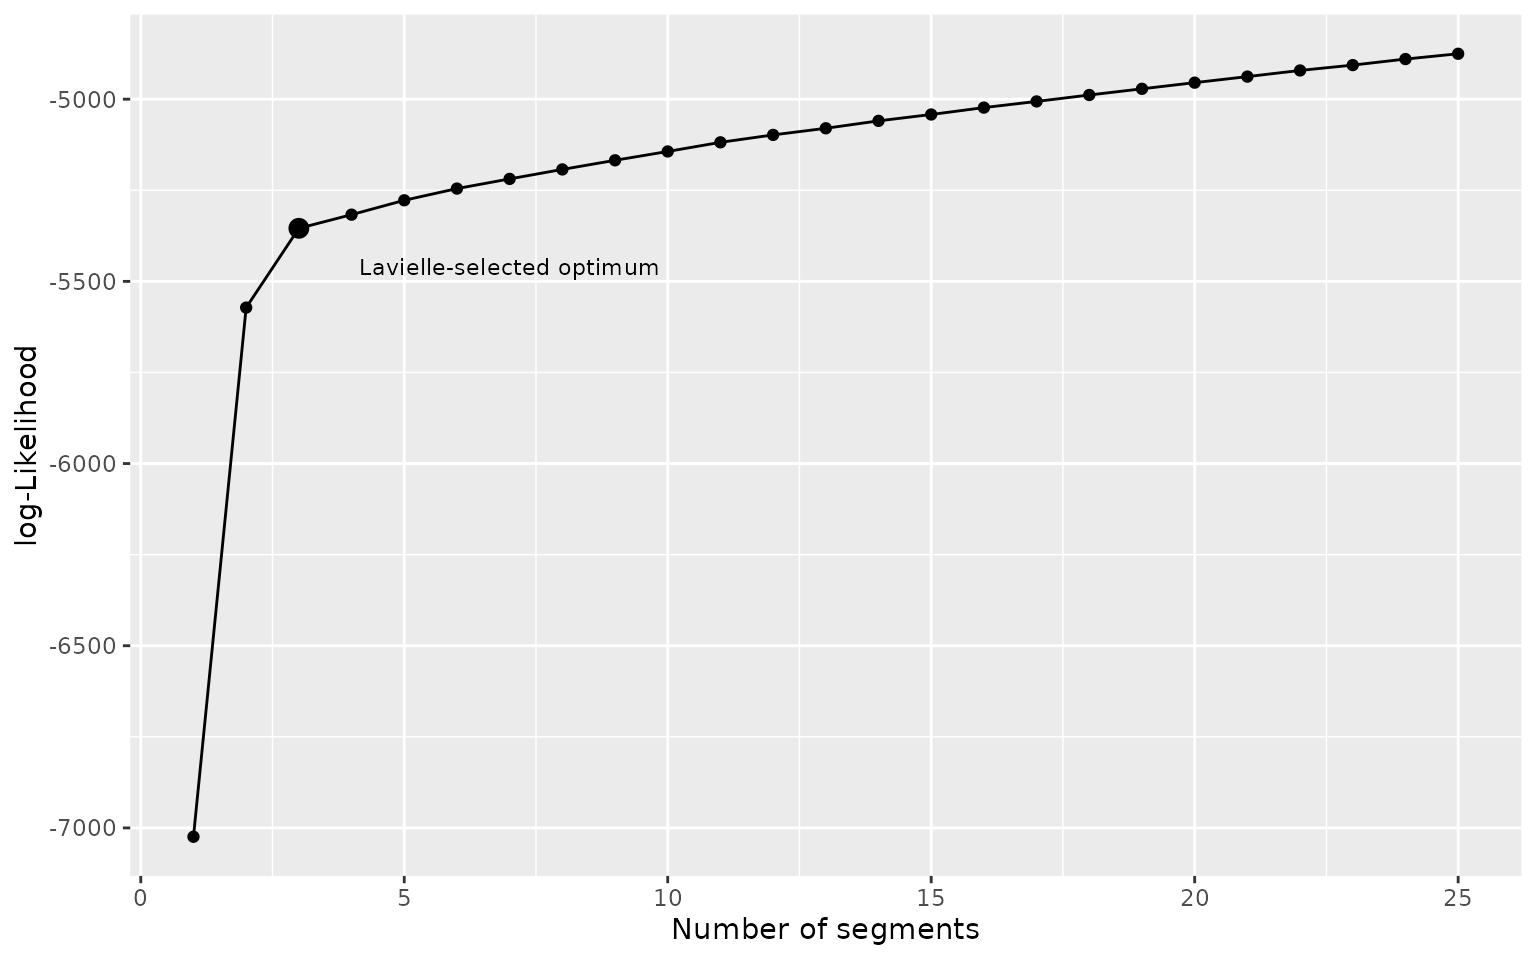
BIC-based penalized likelihood (segclust)
BIC.segmentation() returns information on the BIC-based
penalized log-likelihood of the different segmentations possible. It
returns a data.frame with the number of segments, the BIC-based
penalized log-likelihood and the number of cluster. For
segclust() only. Note that this does not truly return a
BIC. Here highest values are favored (in opposition to BIC)
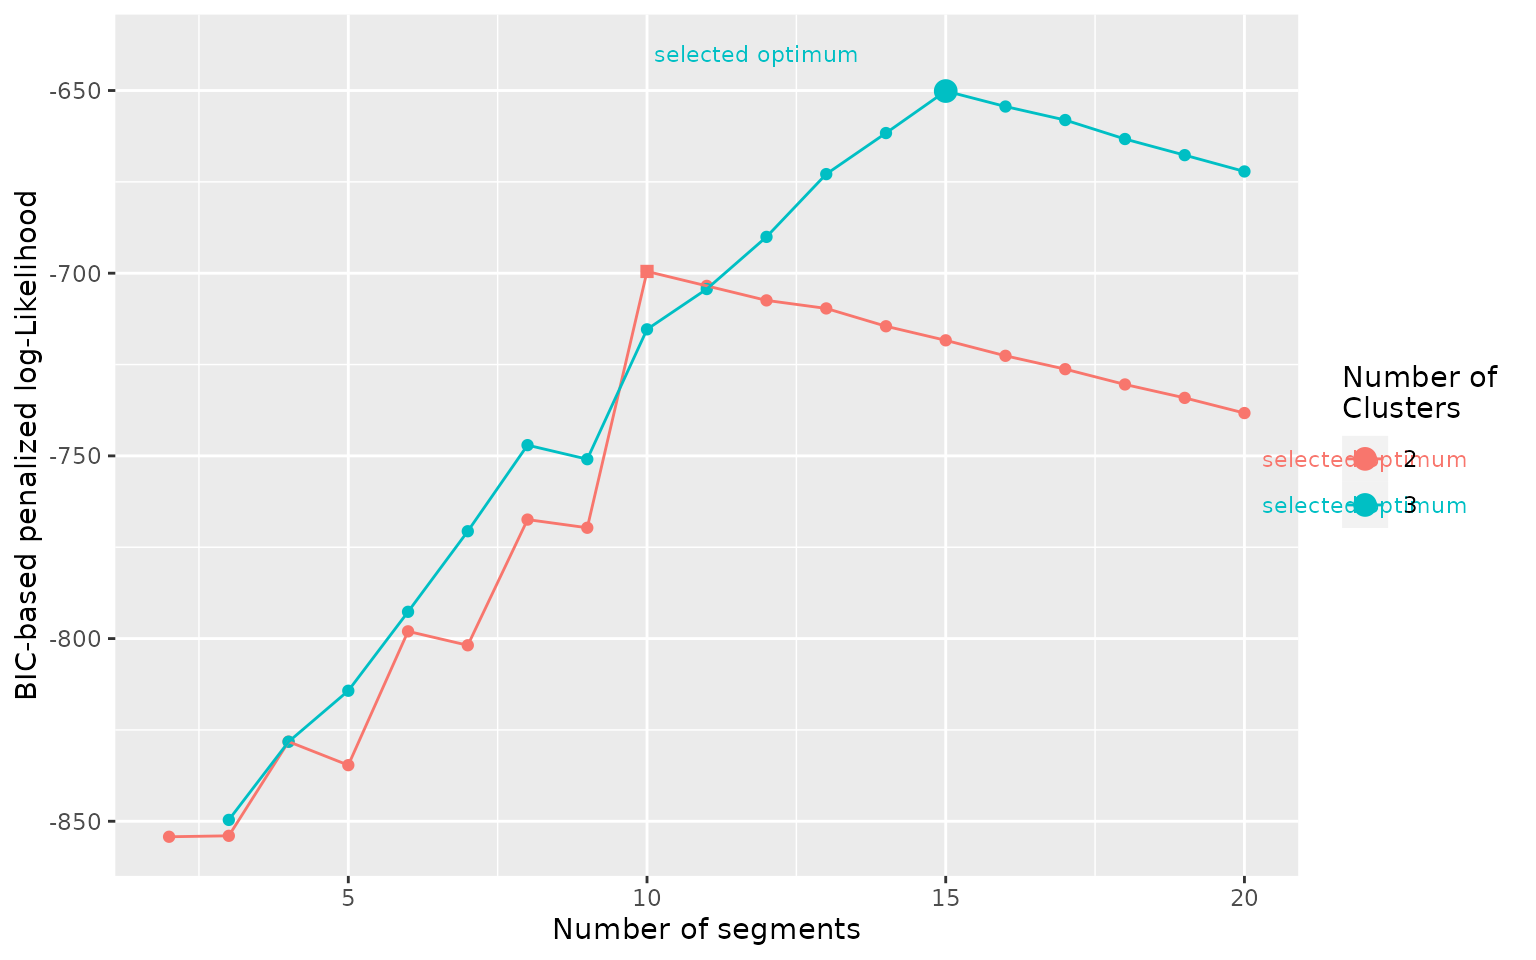
BIC(mode_segclust)plot_BIC() plots the BIC-based penalized log-likelihood
of the segmentation for all the tested numbers of segments and
clusters.
plot_BIC(mode_segclust)